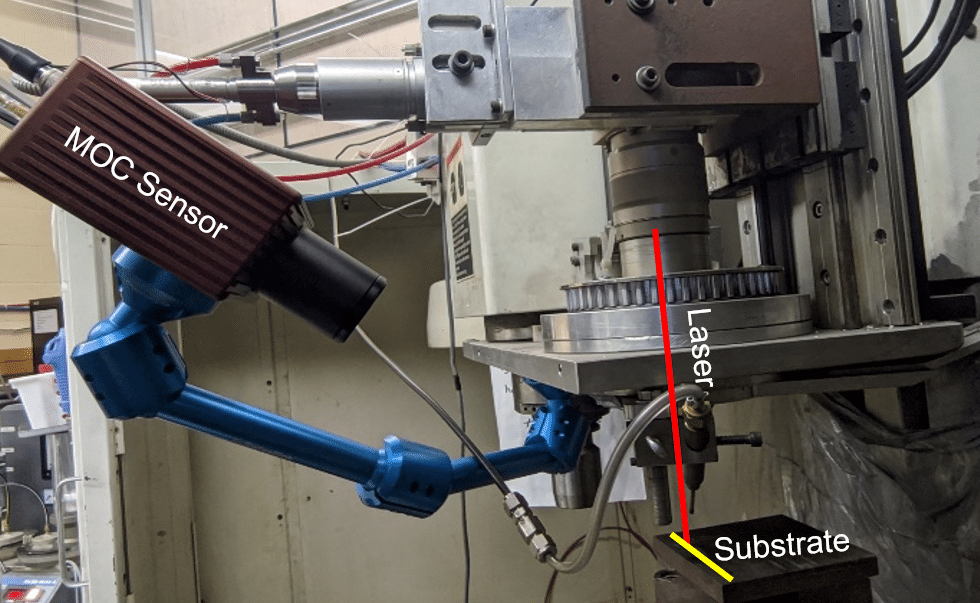
The Solid Freeform Fabrication (SFF) Symposium is an international conference with a focus on additive and advanced manufacturing. The conference has been held for 32 years, demonstrating its history in the field. At the 32nd annual conference Retinex presented our work in Real-time geometry prediction in laser additive manufacturing using machine learning.
Laser additive manufacturing (LAM) allows for complex geometries to be fabricated without the limitations of conventional manufacturing. However, LAM is highly sensitive to small disturbances, resulting in variation in the geometry of the produced layer (clad). Therefore, in this research a monitoring algorithm is discussed with the capability of predicting the geometry of multiple tracks of added material. Though imaging can be used to measure the geometry of the melt pool during LAM, the appearance of the melt pool changes in multi-track processes due to the previous layers causing measurement errors. Hence, a machine learning algorithm may be able to accommodate for the changing melt pool appearance to improve accuracy. Images can be captured during LAM with visible-light and infrared sensors which may provide sufficient information for the geometry to be predicted. A convolutional neural network (CNN) can then use these images to estimate the geometry (height and width) during LAM processes.
A series of experiments were conducted to create the data used to train, validate and test the CNN. The table below summarizes the experiments that were used to create the dataset. Since the purpose of this experiment is to predict the geometry over multiple layers, each experiment featured 5 layers of a 100mm straight track with a height difference of 0.5mm between each layer.

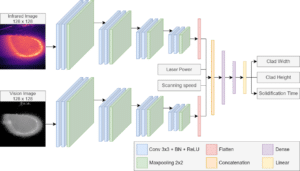
During each experiment videos were recorded in both visible and infrared light, while the geometry was recorded between each layers with macro imaging. The geometry measurements were then lined up with the frames for the recorded videos by using the scanning speed,scale, and framerate of the videos. Therefore, the dataset is created to feature the images and process parameters for each timestep with the corresponding measured geometry. Once the dataset was created and shuffled it was split into subsets as shown in the previous image. The training and validation set were then used to train a CNN with the architecture shown below.
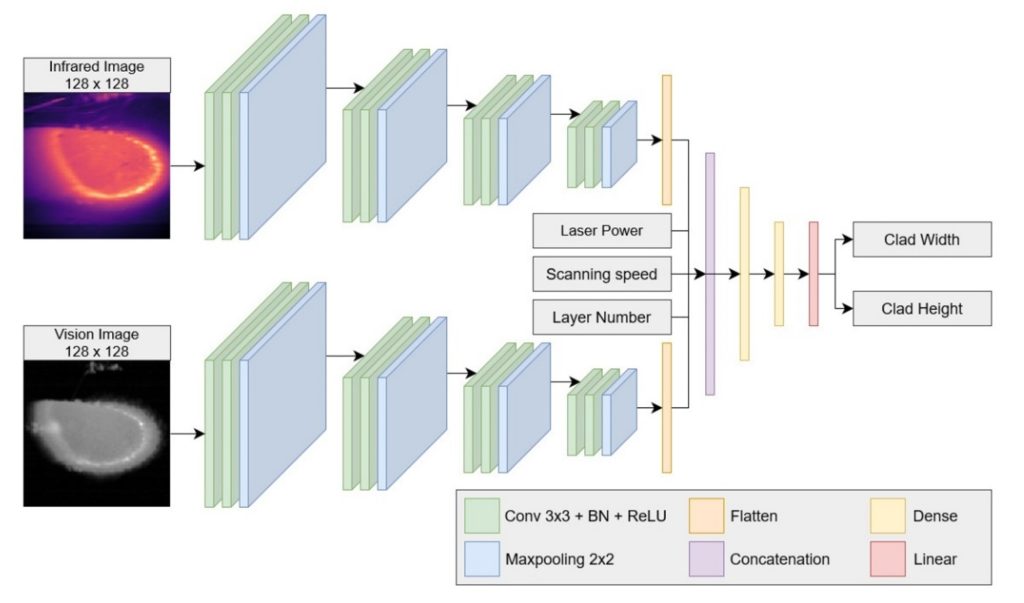
The test subset was then input to the trained CNN with a mean absolute percent error of approximately 1.69%. While the performance against the entire dataset was found to have a mean absolute percent error of approximately 1.57%. The results of the geometry prediction are shown in the image below.
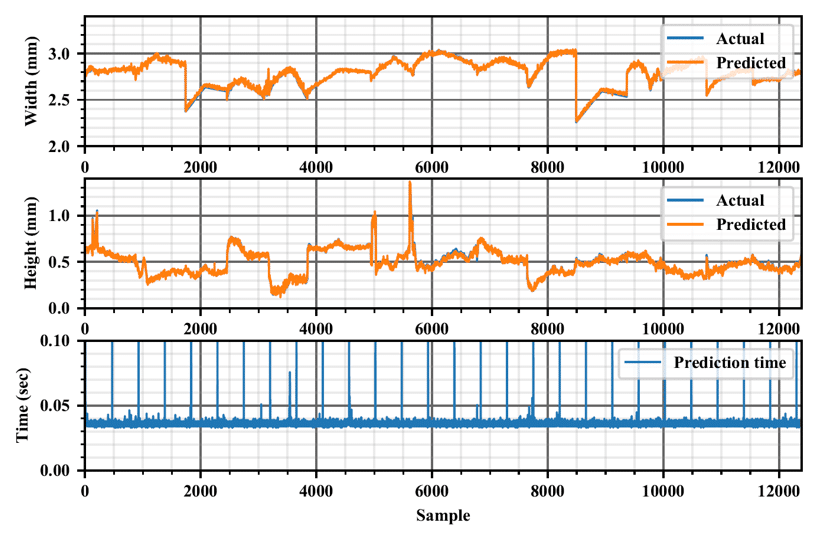
Note that the actual geometry is predicted very well, as shown by the overlap in the above image. The computational time is also shown in the graph, which is an average of 0.037s for the whole dataset and 0.71s for the test subset for every timestep.
To better demonstrate the performance of predicting multi-layer geometry all the predicted layers from experiment are collected in the below image. The purpose of this graph is to determine if there is sufficient accumulation of error when predicted multiple layers.
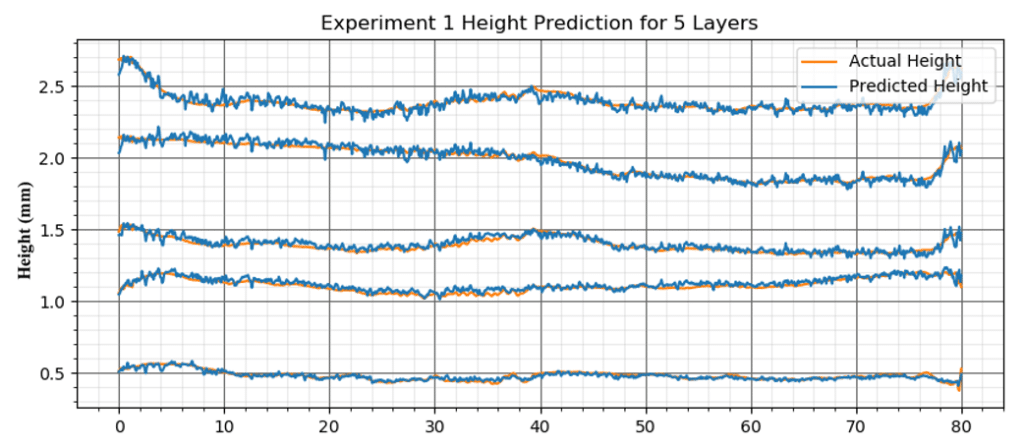
The results show that the trained CNN is sufficient in predicted the geometry (height and width) in real time with minimum error and no noteworthy accumulation of error. However, since these results are only shown with a dataset that featured the same pool of experiments used in the training, validation, and test sets, the performance of this CNN needs to be verified with new data and potentially more training data may be needed.
